


For a property acquired at AED 2 million that generates AED 140,000 in annual rent, the gross yield is a straightforward 7%. This is calculated by taking (Annual Rental Income ÷ Property Purchase Price) × 100.
If you manage a serious portfolio, this is merely the first number on the page. In the current market, it is not the complete story.
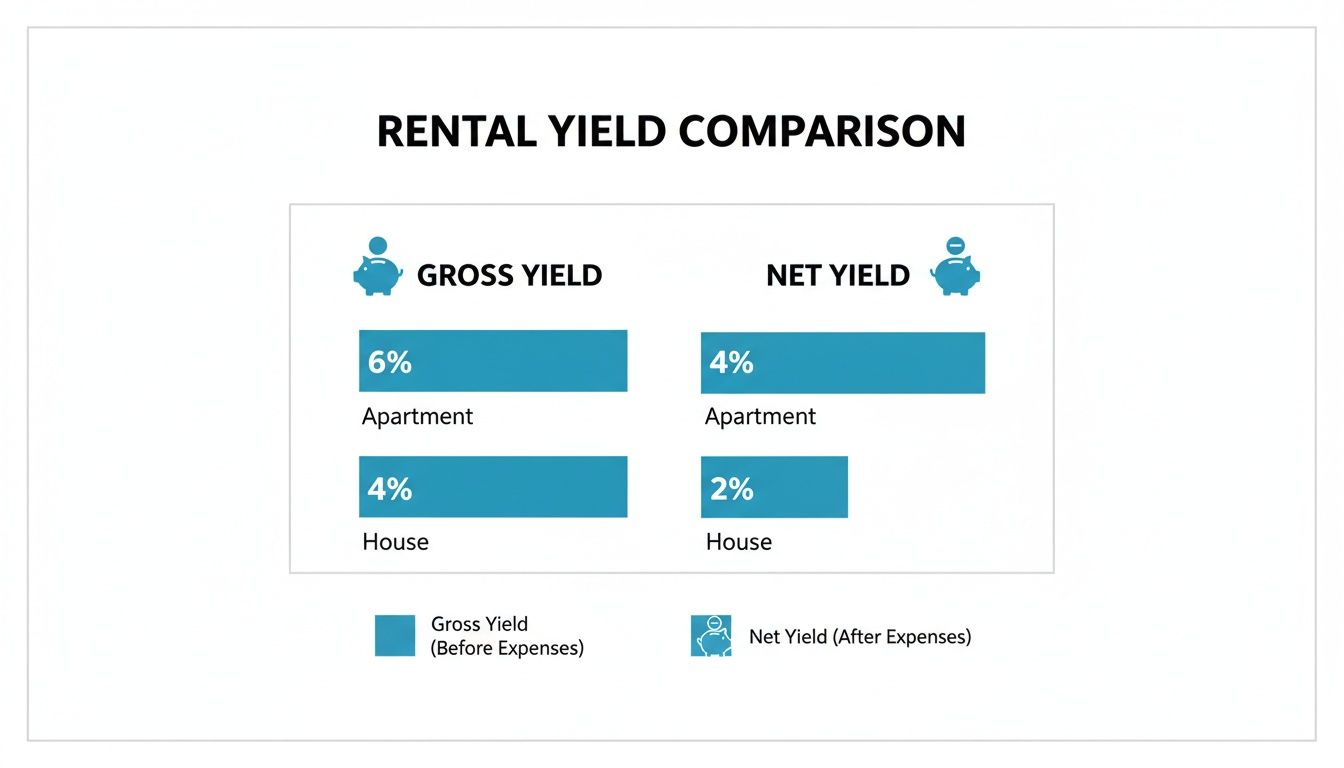
Gross vs. Net Yield: The Only Metric That Matters
Marketing brochures and property listings promote gross rental yield. It is a large, attractive number that is easy to calculate. As asset managers, we identify it as an inflated metric that fails to represent the full financial landscape. We focus on the net rental yield—the sole figure that reflects an investment's true performance.
Gross yield is a top-line glance. It compares total annual rent against the property's purchase price. It is useful for a high-level comparison between neighborhoods or unit types, but it ignores the real-world costs of property ownership.
Net yield, however, is the bottom line. It reveals what remains in your account. This calculation subtracts all annual operating expenses from the rental income before dividing by the purchase price. It is a true measure of the cash flow your asset generates and the only figure for accurate financial forecasting.
The Formulas Defined
The gap between a gross and net yield can be 1.5% to 2.5%, a variance that can alter your long-term strategy. An apartment advertised with an 8% gross yield might deliver a net yield closer to 5.8% once real costs are factored in.
To make this clear, here is a breakdown of how the two calculations compare.
Gross vs. Net Yield At a Glance
| Metric | Gross Yield Calculation | Net Yield Calculation |
|---|---|---|
| Formula | (Annual Rent / Purchase Price) x 100 | ((Annual Rent - Annual Expenses) / Purchase Price) x 100 |
| Components | Only considers total rental income and property cost. | Accounts for service charges, management fees, insurance, maintenance, and potential vacancy. |
| Purpose | Quick, high-level market comparison. | Detailed, accurate performance analysis for investment decisions. |
This table shows why net yield is the superior metric for any serious investor. It replaces optimistic guesswork with a grounded, realistic view of your asset's financial health.
Why Net Yield Governs Strategy
Relying on gross figures is a common error that leads to overestimated returns and poorly allocated capital. Let’s run the numbers on a real-world example.
Imagine a two-bedroom apartment in Dubai Marina, bought for AED 2,000,000. With an annual rent of AED 190,000, the gross yield appears to be an excellent 9.5%. Now, subtract the annual service charges (around AED 36,000) and property management fees (AED 9,500), and your net yield drops to a more sober 7.2%. For a full breakdown, explore our guide on the full spectrum of applicable Dubai property taxes and fees.
For any high-net-worth portfolio, net yield is the core determinant of an asset's viability. It dictates cash-on-cash return, informs refinancing decisions, and separates a performing asset from a financial liability.
As we navigate the 2026 market—defined by sustainable growth rather than last year's speculative frenzy—this level of analytical rigor is not optional. Every investment decision must be stress-tested against net returns to align with your long-term financial goals.
Factoring in the Real Costs of Property Ownership
Gross yield is a vanity metric for a serious investor. To understand how your property is performing, you must account for every operational cost. These are substantial, recurring expenses that directly impact your bottom line.
Based on last year's benchmarks, operating costs for a prime Dubai apartment typically consume between 15% and 25% of the gross rental income. Ignoring these figures means working with a flawed financial model. These costs must be budgeted from day one.
This chart illustrates the difference between the attractive gross yield and the real net yield you actually receive.
As you can see, the operational costs erode the initial headline figure, revealing the asset's true profitability.
Deconstructing Annual Operating Expenses
The primary costs separating net from gross yield are predictable and quantifiable. A disciplined investor catalogues each one.
- Annual Service Charges: This is your largest operational expense. Levied by the developer or owners' association, these charges cover common area maintenance, security, amenities, and chiller fees. For 2026, expect premium communities like Dubai Hills Estate or new towers in Business Bay to command service charges from AED 18 to AED 25 per square foot annually.
- Property Management Fees: For an overseas investor, professional management is essential. The industry standard fee runs between 5-8% of the annual rental income. This service handles tenant screening, rent collection, maintenance calls, and Ejari registration, ensuring your asset is managed according to RERA standards.
- Maintenance and Repair Provisions: Even a new property requires upkeep. I advise clients to set aside at least 1% of the property's value each year into a maintenance fund. This covers minor fixes and builds a cash reserve for future large items, like an AC unit replacement.
Ancillary Costs and Regulatory Fees
Beyond the main three, other mandatory costs are often overlooked in net yield calculations.
One is the DEWA Housing Fee, a charge for expatriates calculated as 5% of the average annual rent in your area. This fee is added to your monthly utility bill. Our dedicated guide explains how these housing charges are calculated by DEWA.
Do not forget landlord insurance. While not compulsory, it is a critical tool for mitigating risk. For a small annual premium, it protects against property damage and loss of rental income.
By forecasting these expenses, an investor transitions from speculation to strategic asset management. The resulting net yield is a robust, defensible metric for sound portfolio decisions.
To put this into perspective, here is a typical expense forecast for a luxury two-bedroom apartment in a new master community, reflecting 2026 market conditions.
Annual Operating Expense Forecast for a Dubai Luxury Apartment (2026 Estimates)
| Expense Category | Estimated Annual Cost (AED) | Percentage of Rental Income |
|---|---|---|
| Annual Service Charges (1,200 sq. ft. @ AED 22/sq. ft.) | AED 26,400 | 14.7% |
| Property Management Fee (5% of AED 180,000 rent) | AED 9,000 | 5.0% |
| Maintenance Provision (1% of AED 3M property value) | AED 30,000 | 16.7% |
| DEWA Housing Fee (5% of rent) | AED 9,000 | 5.0% |
| Landlord Insurance (Estimate) | AED 1,500 | 0.8% |
| Total Annual Expenses | AED 75,900 | 42.2% |
This breakdown shows how quickly operational costs accumulate. An asset with a strong gross return can present a different story once ownership costs are factored in. This granular analysis is the foundation for calculating a rental yield that reflects true performance.
Projecting Yield for Off-Plan Investments
Calculating yield on an owned property is a retrospective exercise. Projecting it for an off-plan property that will be delivered in a few years is a different discipline.
This requires a forward-looking financial modeling exercise. It demands a data-driven approach to forecast the rental market several years from now.

The methodology hinges on creating a reliable estimate of future rental income upon handover. We achieve this by analyzing the performance of comparable ready units in the nearest existing communities.
For instance, when analyzing a new townhouse launch in The Valley Phase 2, we model assumptions on the rental performance of recently handed-over villas in Arabian Ranches 3. We adjust for the superior quality of the new build and confirmed infrastructure upgrades.
The Impact of Phased Payments on Early ROI
A primary attraction of off-plan investment is the leveraged return on capital. Unlike a ready property purchase, your initial cash outlay is a fraction of the total value. This alters how we calculate returns in the pre-handover phase.
Last year, 1% monthly payment plans were common. Entering 2026, the market has matured. Major developers like Emaar and DAMAC have standardized structures to 60/40 or 70/30 plans. While this demands more capital upfront, it signals a more stable, less speculative market.
Let’s model a typical 2026 payment plan for a AED 2.5 million townhouse:
- Booking Fee: 10% (AED 250,000)
- During Construction (36 months): 50% paid in installments (AED 1,250,000)
- On Handover: 40% (AED 1,000,000)
Your capital is deployed incrementally. This structure is central to how we project early-stage returns and capital efficiency. [Chart: 2026 Payment Plan Breakdown]
Forecasting and Risk Mitigation
Forecasting future rent is a nuanced process. We project forward based on the confirmed development pipeline. For a project near the expanded Al Maktoum International Airport, we factor in the future influx of aviation professionals who will require housing. [Map: Location relative to Al Maktoum Airport]
A crucial part of any projection is stress-testing the numbers. We model best-case, expected, and worst-case rental scenarios. This provides a clear band of potential net yield, allowing an investor to make a decision based on data, not a developer's marketing brochure.
In Dubai, the Dubai Land Department and RERA provide robust investor protections. All funds are deposited into a mandated, ring-fenced escrow account tied to the specific project. Funds are released to the developer only upon hitting certified construction milestones, a key component of current UAE property law.
This regulatory oversight ensures capital is secure and used exclusively for the completion of your asset. It is the bedrock of Dubai's off-plan investment model.
Looking Beyond the Brochure: Advanced Yield Metrics
The standard net yield calculation is a starting point. For an HNWI building a serious portfolio, relying on that number alone is a blind spot. Tenants leave and physical assets require replacement.
Institutional-grade analysis models for this reality. Ignoring factors like tenant turnover and the decay of an HVAC unit is the difference between an amateur landlord and a professional asset manager. These are certainties that must be priced into your model from day one.
Modelling for Realistic Vacancy Rates
No property remains occupied 365 days a year, every year. Tenant turnover creates void periods where your asset generates zero income but continues to incur costs like service charges. Banking on uninterrupted occupancy is a common and costly error.
In the current market, building a realistic vacancy provision into your forecast is essential. Based on recent benchmarks, assuming a two-to-four-week void period annually is prudent, even in high-demand communities. This provides a buffer for finding a new tenant, negotiations, and move-in procedures.
Here is how to factor this into your net yield calculation:
- Calculate your Gross Potential Rent (GPR). This is your ideal annual rent if the unit were occupied all year (e.g., AED 240,000).
- Estimate your Vacancy Loss. A 4-week void period is about 8.3% of the year.
- Calculate the loss in dirhams: AED 240,000 x 8.3% = AED 19,920 in lost income.
- Determine your Effective Gross Income (EGI) by subtracting the loss: AED 240,000 - AED 19,920 = AED 220,080.
This EGI of AED 220,080—not the optimistic GPR—is the correct starting point for calculating your true net yield. It provides a more conservative and realistic picture of your income potential. For a deeper dive, our comprehensive Dubai property market forecast offers insights into rental trends.
Allocating a Capital Expenditure (CapEx) Reserve
Capital Expenditures are the large, infrequent expenses needed to maintain your property's value. This is not for fixing a leaky tap; CapEx is for replacing major systems like HVAC units or water heaters. These are not 'if' expenses, but 'when'.
A professional investor proactively funds these costs. We advise clients to build a CapEx reserve by setting aside 1-2% of the property's purchase value annually.
For a property valued at AED 3 million, this means putting aside AED 30,000 to AED 60,000 every year into a dedicated reserve fund. This is a non-negotiable part of sophisticated asset management.
This habit transforms a future financial shock into a planned, budgeted expense. When a major system fails, the money is already there, preventing a sudden cash flow crisis.
This approach is fundamental to preserving the long-term value of your real estate portfolio. By building in both vacancy loss and a CapEx reserve, your yield calculation evolves from a simple snapshot into a strategic financial tool.
Dubai vs. Key Indian Metros: A Head-to-Head Yield Comparison
For the Indian HNWI, the global real estate market presents a canvas of opportunities. When the mission is generating rental income, the numbers make a clear case for Dubai. The data shows two fundamentally different investment climates.
Assets in Mumbai's Bandra Kurla Complex or Gurugram's Golf Course Road are excellent stores of value. Their primary function is capital preservation and long-term appreciation, not immediate cash flow. Gross rental yields in these prime Indian markets consistently hover between 2% and 4%. This positions Indian real estate as a long-term growth play, not an income-generating machine.
Dubai operates on a different financial frequency.
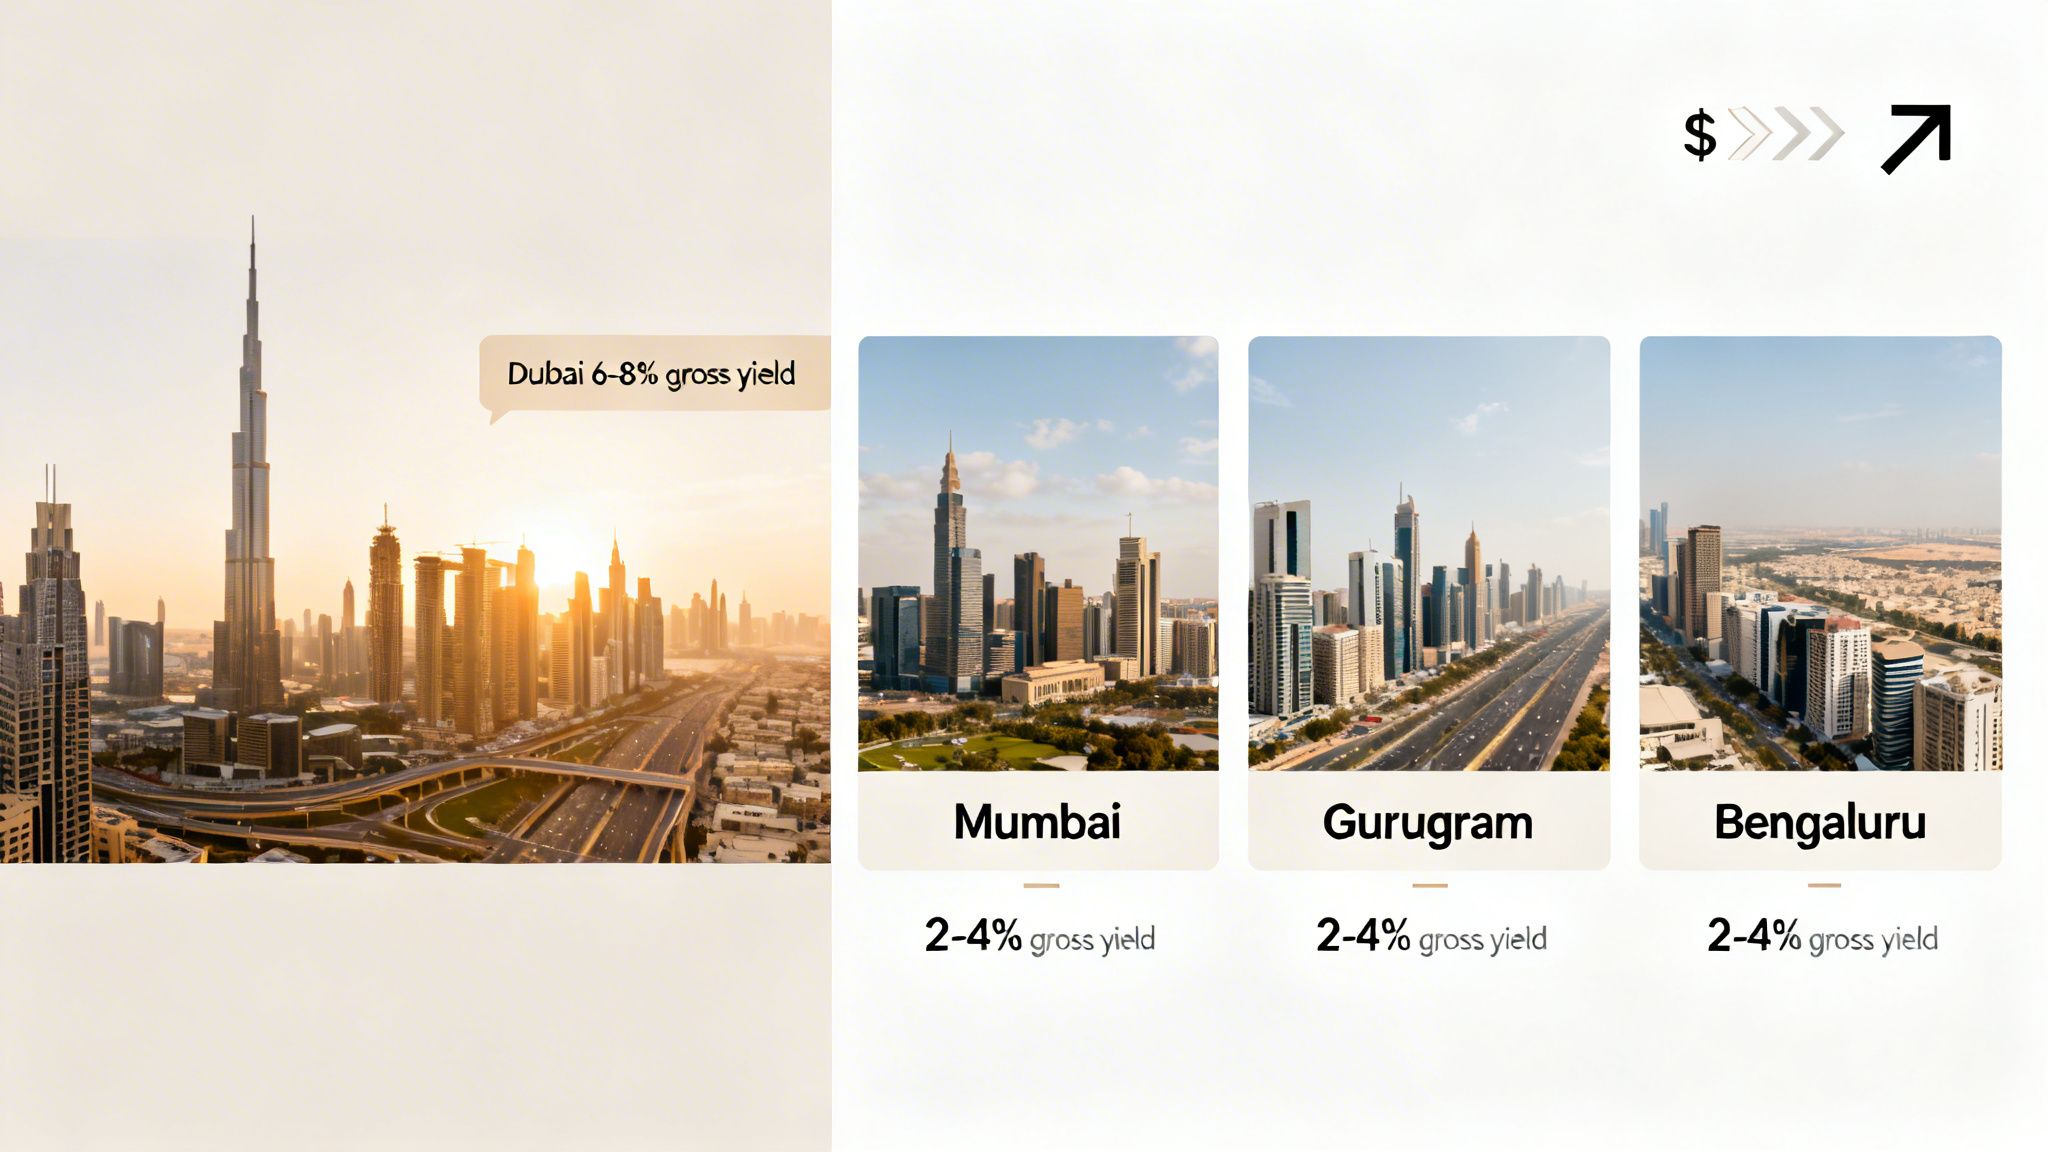
Unpacking the Yield Differential
The contrast is stark. A well-chosen apartment in a master community like Dubai Hills Estate or a branded residence in Business Bay reliably delivers a gross yield between 6% and 8%. After accounting for all operational costs, the net yield frequently lands in the 5% to 6.5% range—substantially higher than the gross yield in major Indian metros.
This is a structural feature of Dubai's economy, driven by powerful factors:
- Tax Efficiency: The lack of income and property taxes is the most powerful driver of superior net yields. Your rental income remains largely intact.
- Currency Stability: The UAE Dirham's peg to the US Dollar provides crucial stability and predictability for foreign exchange returns.
- Global Tenant Demand: Dubai’s status as a global business and tourism hub creates a deep, diverse rental pool. This demand keeps rental rates strong and minimizes vacancy periods.
- Regulatory Clarity: The RERA framework provides a clear, pro-investor legal structure, simplifying tenancy management and contract enforcement.
For an investor accustomed to a 3% yield in Bengaluru's Indiranagar, discovering that a comparable asset in Dubai can generate double that return is a strategic revelation. It shifts the conversation from asset ownership to active cash-flow generation.
A Side-by-Side Financial Showdown
To see the financial impact, let’s run the numbers on a hypothetical investment of approximately INR 4.5 Crore (AED 2 million) in both markets, using Q4 2025 data as a baseline.
| Metric | Prime Mumbai Apartment (Bandra) | Prime Dubai Apartment (Dubai Marina) |
|---|---|---|
| Property Value (Approx.) | INR 4.5 Crore | AED 2,000,000 |
| Gross Annual Rent | INR 13,50,000 | AED 140,000 |
| Gross Rental Yield | 3.0% | 7.0% |
| Estimated Net Yield | ~2.2% | ~5.5% |
The data is unequivocal. For the same capital outlay, the Dubai asset generates more than double the net rental income. For a deeper analysis, explore our report on Dubai property prices compared to key Indian metros.
Moreover, a qualifying real estate investment provides a direct pathway to long-term residency through programs like the Golden Visa UAE, adding a powerful lifestyle benefit to the financial case.
For Indian investors rebalancing portfolios in 2026, the objective is clear. If the goal is rental yield, the data points to Dubai as the mathematically superior choice for deploying capital.
Final Thoughts: Strategy Over Speculation
Knowing how to calculate rental yield is the most important skill for acquiring the right assets in the 2026 market. The period of rapid, speculative gains seen after the pandemic is behind us. We are now in a mature growth cycle where asset performance and financial homework drive success.
The window for easy flips has narrowed. Last year's benchmarks showed a pivot toward sustainability, with smart money flowing into communities with proven infrastructure and real, long-term demand. Winning in this environment means targeting properties in genuine growth corridors—think areas connected to new metro lines or emerging economic free zones.
Moving from Calculation to Execution
Meticulous financial modeling is now the price of entry. The ability to accurately forecast net yield, build in a buffer for vacancy, and set aside a CapEx reserve separates a professional asset manager from an amateur landlord. This analytical rigor ensures every purchase is a deliberate move to strengthen your portfolio.
The latest Dubai real estate market analysis confirms this shift. Yields are holding steady, but the performance gap between well-chosen assets and average properties is widening. Strategic, data-backed decisions consistently outperform emotional buys. The smart money is locked onto assets that deliver predictable cash flow and have clear potential for capital growth tied to confirmed infrastructure projects.
In the 2026 market, your spreadsheet is more powerful than market sentiment. The numbers must lead, and strategy must govern every decision. The most successful portfolios will be built on precise yield calculations and a clear understanding of long-term value.
At Proact Luxury Real Estate, we track these infrastructure corridors and market shifts daily to pinpoint opportunities that withstand intense financial scrutiny. If you are rebalancing your portfolio for 2026, let's run the numbers.
Got Questions? Let's Clear a Few Things Up
As we move from spreadsheets to real-world asset management, practical questions surface. Here are common queries I tackle with clients as they fine-tune their investment models for the 2026 market.
How Do Furnishing Costs Play Into My Initial Yield Calculation?
Furnishing a unit is a capital expenditure, not an operating expense to be written off against first-year rent. For a high-end two-bedroom apartment, a quality furniture package can run between AED 80,000 to AED 150,000.
Deducting this lump sum from your initial rental income would distort your first-year net yield and provide a false picture of the asset's performance.
The professional approach is to amortize that cost over its expected useful life—typically five to seven years. For a AED 100,000 furniture package, you would factor in an annual depreciation of AED 20,000 (over five years) when assessing the property's long-term profitability. This provides a more sustainable financial picture.
Is a Higher Gross Yield Always the Better Investment?
No. An unusually high gross yield can be a warning sign. It might point to a property in a less desirable area with weak prospects for capital growth. Chasing yield alone is a common error.
Consider two scenarios:
- Property A in a secondary location offers an 8% gross yield, but property values in the area have been flat for years.
- Property B in a prime community like Dubai Hills Estate offers a more modest 6% gross yield, but new infrastructure projects mean it is projected to see 10-15% capital appreciation over the next three years.
The savvy investor knows that total return—the sum of net yield and capital growth—is the true metric of success. I would take the lower yield with strong capital appreciation every time.
How Often Should I Recalculate My Property's Rental Yield?
Your yield is a living number, not a static figure. The market is constantly shifting, and your numbers need to reflect that reality.
I advise clients to run a full yield recalculation for every property in their portfolio annually.
This annual review should be based on the current market rent for comparable units, not what your current tenant is paying. You must also update all expenses, especially the latest service charges, which are revised annually. This disciplined approach ensures your asset is performing at its peak and helps you spot underperforming properties that may require a new strategy.